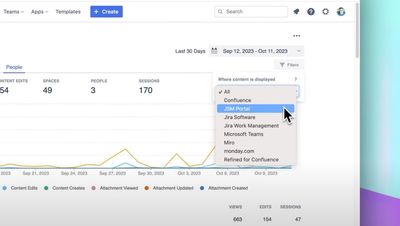
If you've used our Google Analytics in Confluence app, you'll already know that it beautifully and succinctly displays reports for spaces, content and people, from which you can drilldown further to see new insights for Confluence usage.
But what if you wish to see the Confluence reports natively in the Google Analytics interface?
This article provides a step by step guide on how to do just that, as well as a video walkthrough.
As well as reports for native Confluence content, we describe how to report on articles displayed in Jira Service Management Portal articles.
Video walkthrough
If you prefer videos, go ahead and look at the video here:
If not, read on.
Building custom reports
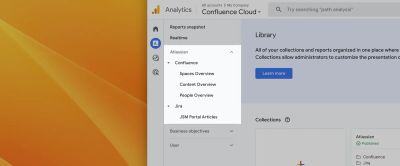
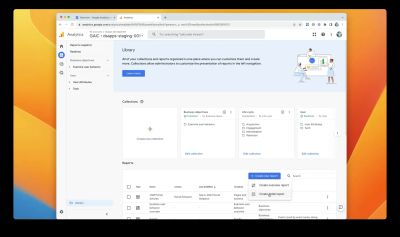
In Google Analytics, select the correct property, then select Reports from the left hand menu.
Then select Library from the bottom left:
Spaces Overview Report
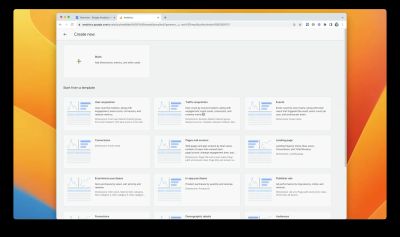
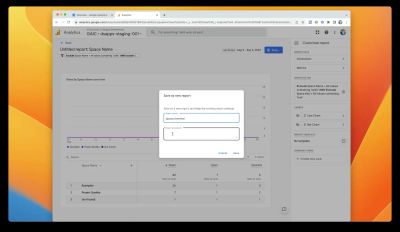
Press the "+ Create new report" button & select "Create detail report":
In the Create new report screen, select Blank to create a blank report
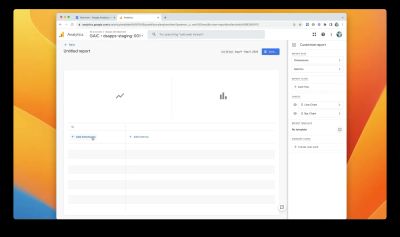
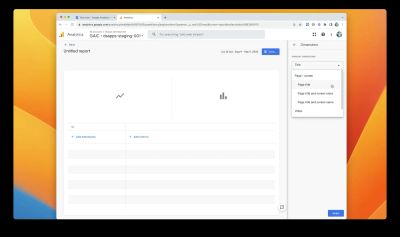
Add dimensions
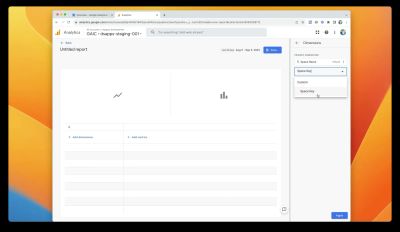
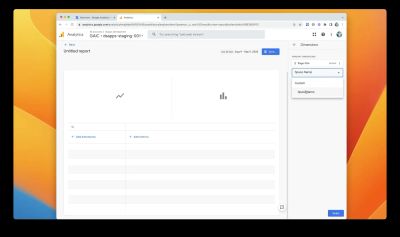
In the report screen, select + Add dimensions
Then select Space Name and Space Key from the dropdown menus:
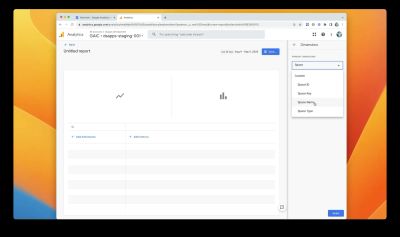
Then press the Apply button in the bottom right.
Add metrics
Click in the Metrics field:
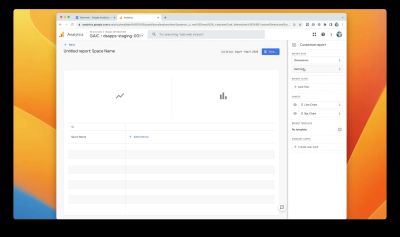
Then select Page Views, Users and Sessions:


Then press the Apply button in the bottom right.
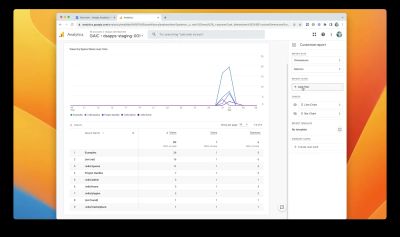
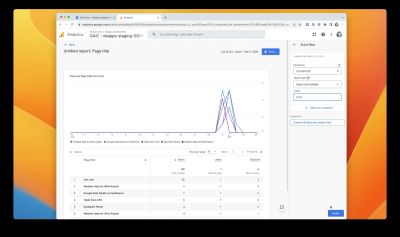
The report is now displayed, but we are not interested in the Bar Chart, so can hide that by clicking on the eye icon:
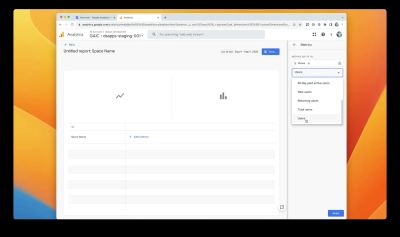
Filtering
Some unwanted data is displayed, Space Name such as "(not set)" or "/wiki/*". This data is not invalid, but it is not required in our reports, so can be discarded here. The data can be removed with filtering.
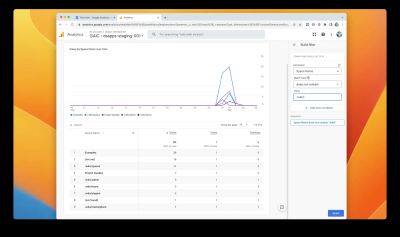
Select "+ Add filter from the "Customize report" section:
Select "Space Name" as the Dimension, "does not contain" as the Match Type and type "/wiki/" as the Value, then "+ Add a new condition":
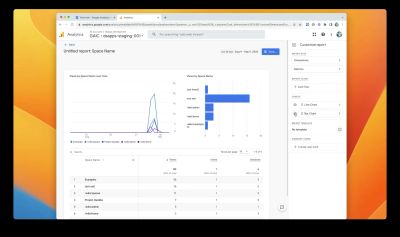
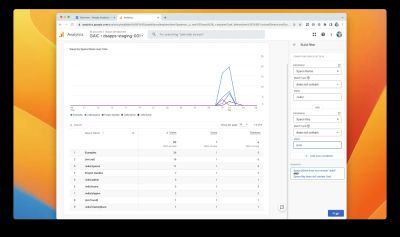
Select "Space Key" as the Dimension, "does not contain" as the Match Type and type "(not " as the Value, then press then "Apply" button:
The report is now much cleaner:
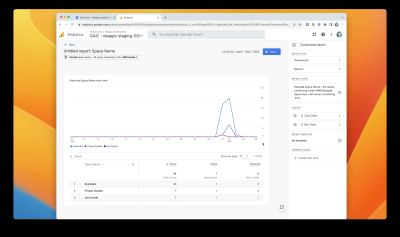
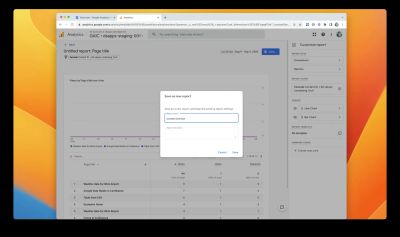
Press the "Save..." button and name your report "Spaces Overview"
Content Overview Report
On the Library screen, press the "+ Create new report" button & select "Create detail report":
In the Create new report screen, select Blank to create a blank report
Add dimensions
In the report screen, select + Add dimensions
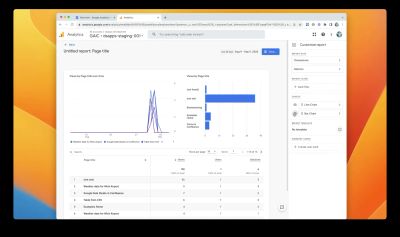
Then select Page title and Space Name from the dropdown menus:
Then press the Apply button in the bottom right.
Add metrics
Click in the Metrics field:
Then select Page Views, Users and Sessions:


Then press the Apply button in the bottom right.
The report is now displayed, but we are not interested in the Bar Chart, so can hide that by clicking on the eye icon:
Filtering
Some unwanted data is displayed such as "(not set)" or "/wiki/*". This data can be removed with filtering.
Select "+ Add filter from the "Customize report" section, then select "Content ID" as the Dimension, "does not contain" as the Match Type and type "/wiki/" as the Value, then "+ Add a new condition":
The report is now much cleaner:
Press the "Save" button and name your report "Content Overview"
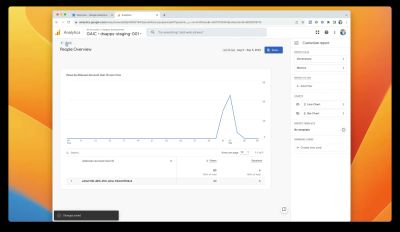
People Overview Report
We can repeat the same process as in the last 2 examples to build a "People Overview" report, but instead of the user's names, we will use Atlassian Account User ID as the custom dimension (because it is not permitted to store PII within Google Analytics).
For metrics, we use Views and Sessionss, and the report will look similar to this:
Jira Service Management Portal Articles Report
JSM portal articles are rendered from Confluence, so our Google Analytics in Confluence app can track views of articles displayed in JSM Portal.
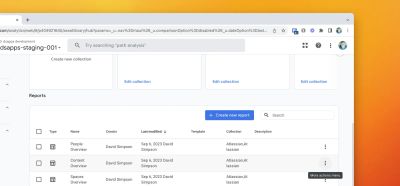
Duplicate the Content Overview Report
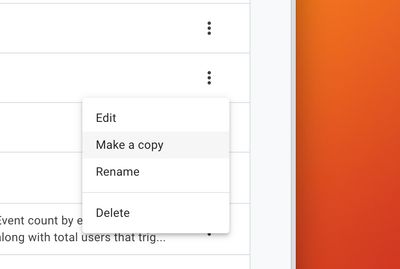
On the Library screen, copy the Content Overview report you built earlier.
Select "more actions/ ••• ", then "Make a copy"
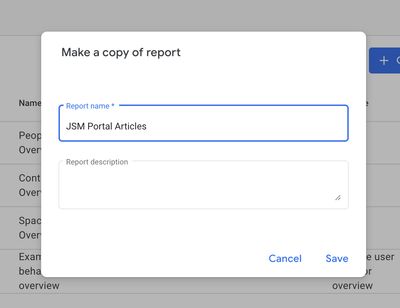
Then save the report as "JSM Portal Articles"
Update the filters
Clear the existing report filter:
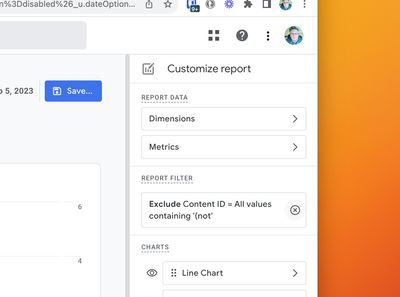
Add a new filter using the Dimension "Parent Product" with a Match Type of "exactly matches" and Value of "JSM Portal", then press "Apply":
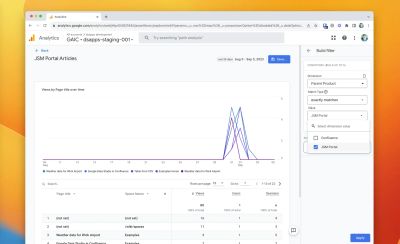
A new report is produced with just content views for JSM Portal Articles.
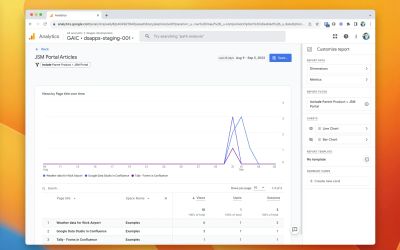
Press the blue Save... button to save the updated version of the report.
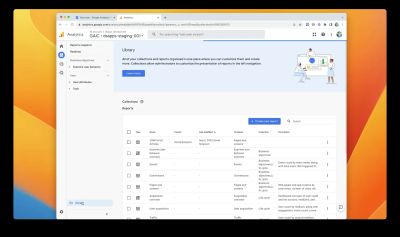
Displaying collections and topic within Google Analytics 4
You can save your custom reports in collections that display in the left hand menu in Google Analytics 4. Details of how to do this are in the video above, starting at 08:50.
Conclusion
This step by step guide should have provided you with a introduction into building custom reports for Google Analytics 4 with a focus on our integration with Atlassian Confluence and JSM.
This article is part of our complete guide to Google Analytics in Confluence.