Confluence content is spreading its wings and appearing in new places where it has not traditionally appeared.
Atlassian supports embedding Confluence content in several places in Jira
- Jira Service Management portal articles
- Project Pages in Jira Software and Jira Work Management
Atlassian have recently opened up Embedded Pages – the technology that allows this – to be used by third parties. So now you can see your Confluence documentation in new places such as Microsoft Teams, monday.com, Google Workplace, Miro, Refined for Confluence and many more.
Your content can now travel far and wide.
While this newfound versatility is undoubtedly a game-changer, it also brings with it a crucial question:
How do you keep tabs on who's viewing your Confluence content, where they're viewing it, and when they're doing so?
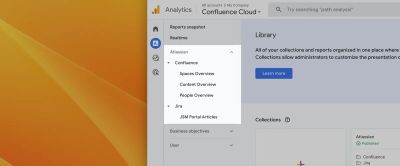
Introducing Google Analytics in Confluence
Google Analytics in Confluence is your compass in the vast sea of digital content. It's the key to understanding your audience, their preferences, and their engagement patterns across a myriad of platforms. With this invaluable tool, you gain access to detailed insights, enabling you to make data-driven decisions and refine your content strategy.
Tracking Content Usage Across External Apps
One of the most significant advantages of Google Analytics in Confluence is its ability to track content usage across external applications.
Whether your Confluence documentation finds its home in Microsoft Teams, monday.com, Google Workplace, or any other integrated platform, you can now gain real-time insights into how your content is being consumed.
With the help of user-friendly reports, you can discover:
- Who's Engaging: Identify the individuals or teams interacting with your content, enabling you to tailor your messaging to their needs.
- Where They're Engaging: Pinpoint the external applications where your content is making the most impact. This information can help you fine-tune your content distribution strategy.
- When They're Engaging: Understand the times and dates when your content receives the most attention. This insight can be invaluable for optimizing content release schedules.
How Google Analytics in Confluence works
To get a glimpse of Google Analytics in Confluence in action, watch our video tutorial above.
The video walks you through the process of accessing and interpreting the data-driven reports, filtering content views by external app, helping you harness the full potential of this integration.
As the digital landscape continues to evolve, having the ability to track and analyse your content's performance across various platforms is a competitive advantage. Google Analytics in Confluence empowers you to be proactive, responsive, and informed. It's time to unlock the true potential of your Confluence content and make data-driven decisions that drive your organisation forward.
This article is part of our complete guide to Google Analytics in Confluence.