Since we first released Google Analytics in Confluence, it has recorded over 150 million page views for just under 1000 Confluence Cloud customers worldwide. This app has been hosted by us, on your behalf, for free, up until recently.
In March, we moved to a paid model so that we can improve the features of the app and allow companies and organisations to more easily understand how users behave and how they collaborate and consume content.
To this end, the June 2020 release now not only collects analytics data, but also displays analytics reports within Confluence.
The new improved reporting functionality delivers...
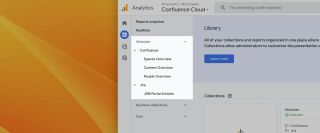
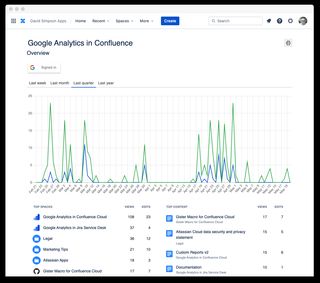
Analytics overview
For Confluence as a whole, it delivers
- Usage over time
- Top spaces
- Top content
- Top users - showing views and also their editing contributions
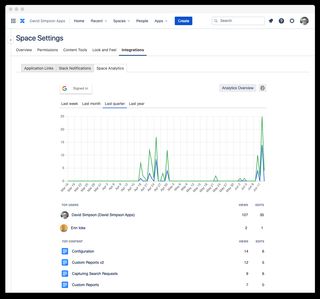
Space analytics
For each individual space, it delivers
- Usage over time
- Top content
- Top users - showing views and also their editing contributions
Page analytics
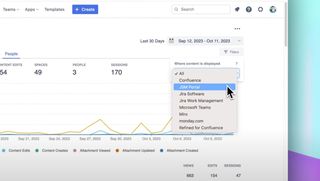
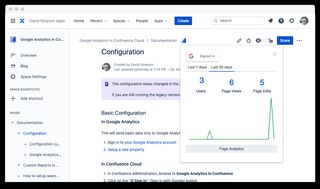
Page summary dropdown
A convenient summary of activity for individual pages is available as a dropdown menu on the page.
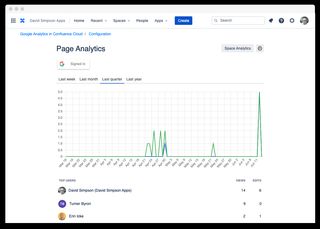
Page analytics details
For each individual page, it delivers
- Usage over time
- Top users - showing views and also their editing contributions
Print reports
All reports can be printed or exported to PDF. This allows administrators to share the report with other people within the organisation.
This is just the beginning. We'd love you to try out the new version of Google Analytics in Confluence by starting a 30 day trial.
We are actively improving the app and adding features.
If you are a current paying customer or using the trial, you will automatically be updated to the new version.
One other thing we'd also like to let you know is that we are winding down the previous
version of the app (which was available until March 2020) over the coming months.
For users of the previous free version, as time progresses, we will no longer be able to support multiple versions of the app. We will start by rate limiting the data collection in the next few days for, so if you are not ready to try out the new version, expect to see a drop in reported page views from June 2020. Thank you for using the app up until now and we hope that you will continue in the future.
Photo by Maxim Hopman on Unsplash