Your business intelligence data lives in Tableau, Power BI, Looker, or one of a dozen other tools. Your team lives in Confluence. Getting those two things to coexist has traditionally meant one of three things: exporting screenshots (which go stale immediately), sharing links that require separate logins, or granting everyone access to the BI tool whether they need it or not.
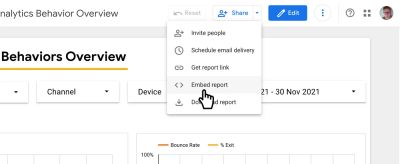
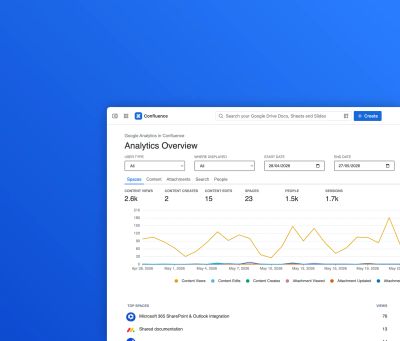
BI Dashboards in Confluence solves this with a simple embed model: share a dashboard in your BI tool, copy the embed URL, paste it into a Confluence macro. Your live report appears inside Confluence – no exports, no logins, no context switching.
Why embed BI dashboards in Confluence
The value isn't just convenience. When dashboards live alongside the documentation, decisions, and discussions that reference them, your team actually uses them. A sales dashboard embedded in the weekly standup Confluence page gets looked at every week. The same dashboard buried in Tableau gets checked when someone remembers it exists.
Embedded analytics closes the gap between data and context.
→ What embedded analytics is and why it gives you better business outcomes
Supported tools
BI Dashboards in Confluence supports 21+ analytics and business intelligence platforms via dedicated Confluence macros:
- Microsoft Power BI – embed reports and dashboards from Power BI Service
- Tableau – embed views and workbooks from Tableau Cloud
- Looker – embed Looks, Explores and dashboards from Looker
- Looker Studio (formerly Google Data Studio) – embed reports from Google's free BI tool
- Holistics – embed dashboards and reports
- Knowi – embed widgets and dashboards
- MongoDB Charts – embed charts from MongoDB Atlas
- Geckoboard, GoodData, Metabase Cloud, Mode Analytics, Qlik, Sigma, Domo, Cluvio, cumul.io, Datapane, Datawrapper, Observable, Trevor.io, Zoho Analytics – all supported
Each integration is purpose-built rather than a generic iframe – the macros handle authentication flows, aspect ratios, and responsive rendering correctly.
→ BI Dashboards in Confluence updated – now with 21 integrations
How it works
The process is the same for every supported tool:
- Share the report in your BI platform and copy the embed URL
- Add the macro to a Confluence page – search for your tool by name in the macro browser
- Paste the URL – the dashboard renders live in Confluence
That's it. The report updates automatically as the underlying data changes. No re-embedding, no screenshots, no manual refreshes.
→ BI Dashboards in Confluence – first release on the Atlassian Marketplace
Spotlight: Looker in Confluence
Looker's embedded analytics capabilities make it a particularly strong fit for Confluence. Looks, Explores, and full dashboards can all be embedded, giving your Confluence pages access to Looker's full query and visualisation power.
→ Spotlight on Looker in Confluence – embedded analytics made easy
Aspect ratio and display control
Every macro supports configurable aspect ratios – so your dashboards display correctly whether they're portrait financial reports, landscape Tableau views, or widescreen Power BI dashboards. This was a common pain point with generic iframe embeds that the dedicated macros solve.
→ Aspect ratio support added for all our Confluence macro integrations
Use cases
Enhance your workflows with David Simpson Apps
Discover powerful apps and integrations for monday.com, Atlassian, and Microsoft 365. Streamline processes, embed analytics, and boost collaboration.
Explore appsExecutive reporting – embed a live Power BI or Tableau executive summary in the quarterly planning Confluence space. Everyone sees the same numbers, in context with the narrative.
Product analytics – embed a Looker dashboard on the product team's space homepage. Sprint reviews reference the same data that's driving the decisions.
Finance and operations – embed Sigma or Mode dashboards alongside budget documentation, so actuals and plans sit on the same page.
Customer success – embed Geckoboard or Domo dashboards in account-level Confluence pages to track health scores alongside account notes.
Data science teams – embed Observable notebooks or MongoDB Charts alongside the documentation that explains the methodology.
Related: individual tool integrations
Several of the supported tools also have dedicated standalone apps on the Atlassian Marketplace for teams that need deeper integration with a single platform:
- Looker in Confluence
- Looker Studio in Confluence
- Microsoft Power BI in Confluence
- Holistics in Confluence
- Knowi in Confluence
- MongoDB Charts in Confluence
Get started
BI Dashboards in Confluence is available on the Atlassian Marketplace with a free trial. If your preferred BI tool isn't yet listed, get in touch and we'll look into adding it.