The Analytics Overview screen has the following features:
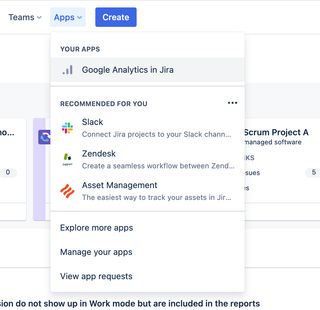
The analytics overview screen is accessed from the Apps dropdown menu in the Jira header
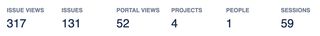
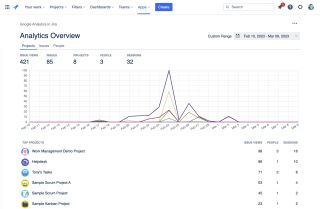
Headline figures
For the selected time period, this provides:
- Issue Screen Views, No. of Issues Viewed, Portal Views NEW, No. of Projects Viewed, People & Sessions
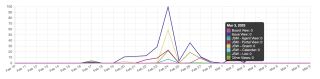
Usage over time
Issue screen views broken down into the various contexts
Board View & Issue View
Jira Service Management Views
- Agent Views & Portal Views
Jira Work Management Views
- Board, Calendar & List Views
Any other issue view
All timelines are colour-blind friendly with accessible colours being used
Projects Report
Issue Views, People & Sessions
Each project listed is a link to the Project Analytics report for the project
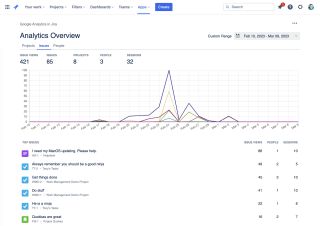
Issues Report
Issue Views, People & Sessions
Each issue listed is a link to the Issue Analytics report for the issue
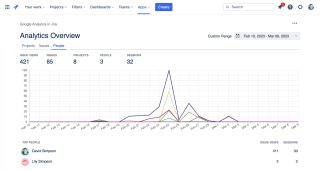
People Report
Showing views and also their editing contributions…
Issue Views & Sessions
Each person listed is a link to the People Analytics report for that person
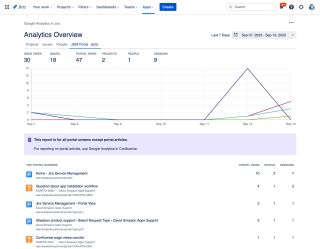
JSM Portal Report
Reporting for all JSM Portal screens except Portal articles – these cannot be track using Google Analytics in Jira, instead use Google Analytics in Confluence
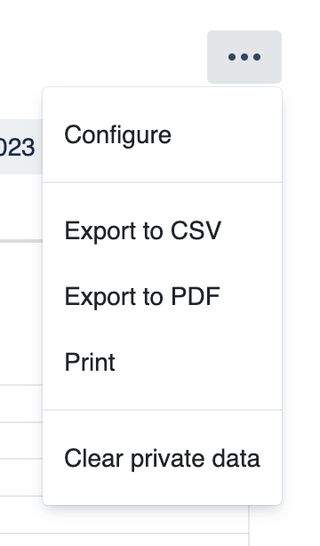
Tools Menu
For admins, gives access to the configuration screens
Gives export options – CSV, PDF or Print
Clear private data – Removes reports data cached in the browsers' localStorage
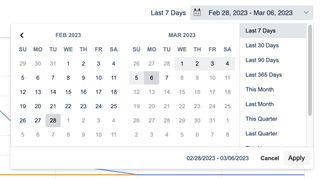
Date picker
Allows you to select the date range required