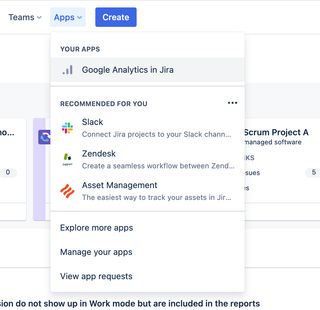
The reporting screens are accessed from the Apps dropdown menu in the Jira header
The reporting screens
Reporting is broken down into the following screens
The interface
The interface has been designed to display the maximum amount of information "above the fold" so that the you can maximise your knowledge of the most engaging spaces, content and people before you even need to scroll the page.
Each screen has a tabbed interface (except Issue Analytics) and has the following structural elements:
- Tabbed navigation – allows access to the various reports

- Headline figures – show the headline numbers/values for the screen

Timeline – the content views, edits and creates for the site, space, content item or person
- All timelines are colour-blind friendly with accessible colours being used throughout
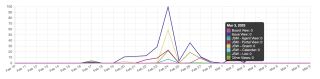
Table of results
- Details of content views, content edits, people and sessions for the item
Tools menu
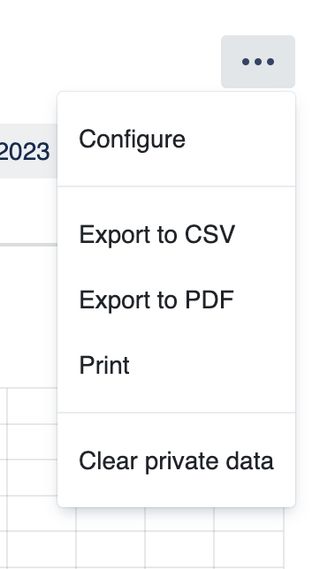
* Allows navigation to the next largest category e.g. * Navigation from Issue Analytics to Project Analytics and Analytics Overview * Navigation from Project Analytics to Analytics Overview * Navigation from People Analytics to Analytics Overview * Gives export options – CSV, PDF or Print * Clear private data – Removes reports data cached in the browsers' localStorage
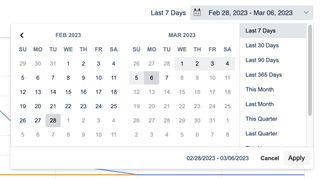
Date picker – allows you to select the exact date range required, or choose from sensible presets
- Retains the familiar position in the top right of the screen just like in Google Analytics