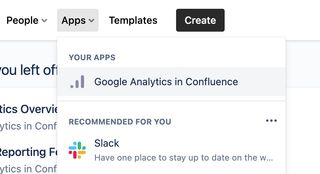
The Analytics Overview screen is accessed from the Apps dropdown menu in the Confluence header
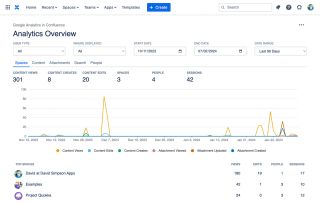
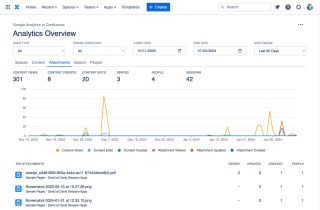
Headline figures
- Content Views, Content Creates, Content Edits, Spaces Viewed, People & Sessions

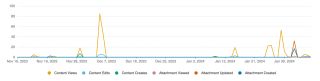
Usage over time
- Content Views, Content Creates & Content Edits
- Attachments viewed, updated & created
- All timelines are colour-blind friendly with accessible colours being used
Spaces Report
- Content Views, Content Edits, People & Sessions
- Each space listed is a link to the Space Analytics report for the space
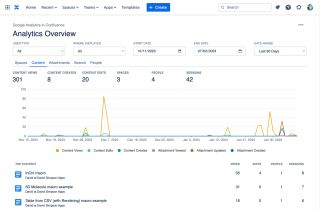
Content Report
- Content Views, Content Edits, People & Sessions
- Each page or blogpost listed is a link to the Content Analytics report for the content
Attachments Report
Displays a list of top attachments. For each attachment the following data is displayed
- Attachments Viewed, Attachments Updated, Attachments Created
- The number of people who have interacted with the attachment
- A link to view/download the attachment
- A link to the Content Analytics screen for the parent page for the attachment
- A link to the Space Analytics screen for the parent space for the attachment
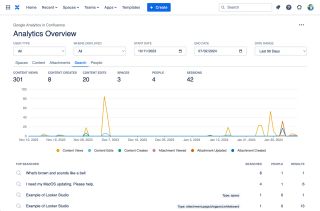
Search Report
Showing top search terms, the number of people who have searched for that term and the number of search results found.
This report allows you to see what is being searched for and importantly whether any results have been found for the search term.
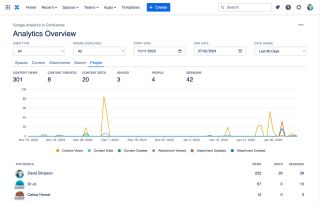
People Report
Showing views and also their editing contributions…
- Content Views, Content Edits & Sessions
- Each person listed is a link to the People Analytics report for that person
- Guest users are marked with a GUEST label
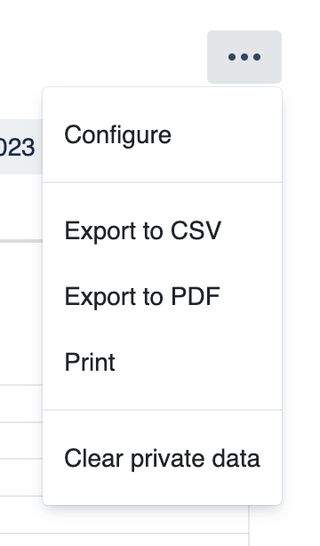
Tools Menu
- For admins, gives access to the configuration screens
- Gives export options – CSV, PDF or Print
- Clear private data – Removes reports data cached in the browsers' localStorage
Filter Controls Row
- Filter
- By user type – All users, internal users, guest users
- By where – The parent product where the content is displayed – All, Confluence, Jira, JSM, Jira Work Management, monday.com, Refined for Confluence, etc
- Separate simple controls for date selection
- Date pickers for start and end dates
- Date Range picker with sensible default date ranges
- Retains the familiar position in the top right of the screen just like in Google Analytics

Drilldowns
On the People tab, you can now drill down to view the content that each person has been interacting with: