In Google Analytics
Sign in to your Google Analytics account We recommend you use a shared service account and document who has access to this account within Confluence.
Set up Analytics for a new website
- On the Start collecting data screen, select:
- Choose a platform: Web
- On the Set up data stream screen, set the following:
- Website URL:
yourcompanyname.atlassian.net/wiki - Stream name: Confluence Cloud
- Website URL:
- On the Start collecting data screen, select:
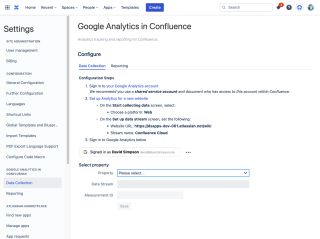
In Confluence
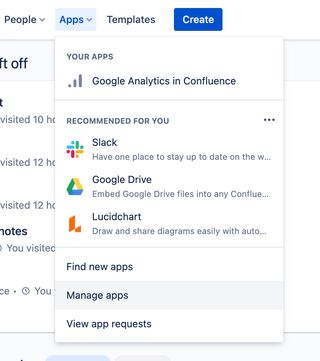
From the Apps menu, select Manage Apps.
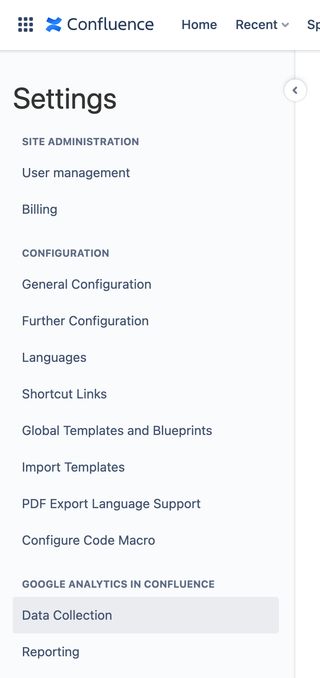
Then from the left hand menu, select Data Collection under the Google Analytics in Confluence heading.
Sign in with Google
Press the Sign in with Google button

A new window opens for you to sign to Google.
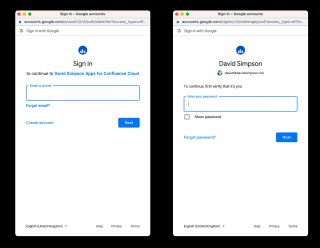
If you're not already signed in, you'll see a username, and then password screens.
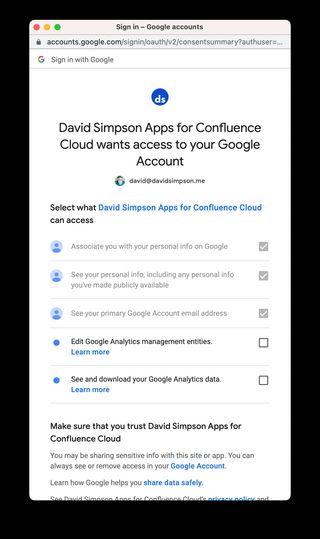
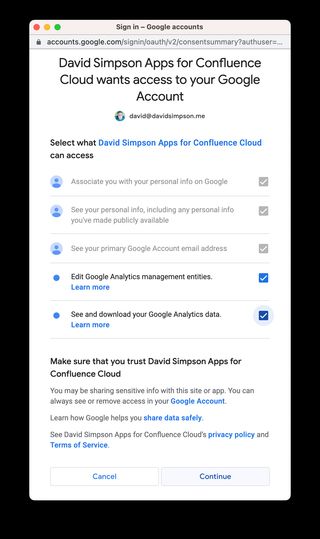
After signing in with Google, you'll see this screen.
Make sure that you check the boxes:
- ✅ Edit Google Analytics management entities
- ✅ See and download Google Analytics data
Then scroll down and press Continue.
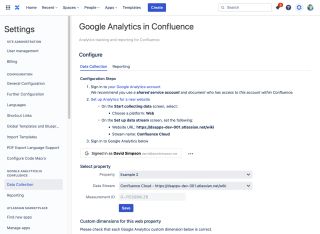
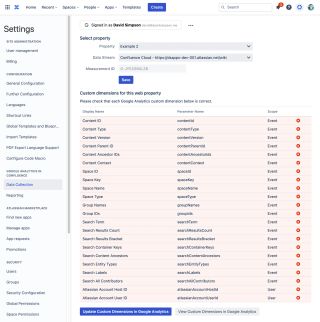
Configure Property
You will be redirected back to Confluence and then be able to select a property from the Property dropdown.
If necessary, select a Data Stream – likely this is already populated – then press Save.
You should then see this confirmation.
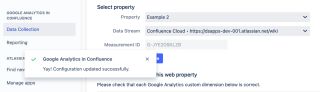
If not, reload the page and try again.
Configuring Custom Dimensions
Completion of the previous step will now automatically trigger configuration of the custom dimensions.
For the app to work correctly, you have ensure that the custom dimensions have been created. Details of the custom dimensions used can be found here – Custom Dimensions used for data collection
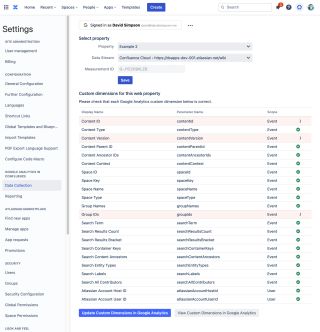
If you see any red crossed next to the custom dimension, then take the next step…
Press the Update Custom Dimensions in Google Analytics button.
It takes a few seconds to create the custom dimensions, and you'll see some loading indicators while this happens.
When all custom dimensions have been created, you see a nice green column of checks.
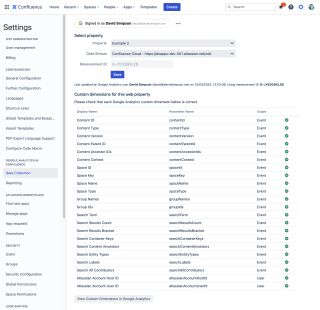
Data collection is now configured.
Scroll up and press the Reporting tab to Configure Reporting.
To configure integration with Refined for Confluence, view the separate article: Integration with Refined for Confluence Cloud