The Space Analytics screen is accessed from the Google Analytics in Confluence menu item in the Apps section of the left hand menu when in a space:
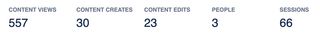
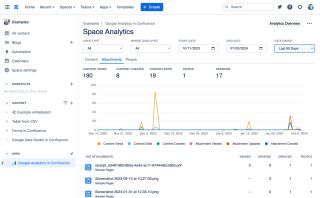
Headline figures
- Content Views, Content Creates, Content Edits, People & Sessions
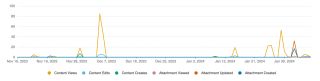
Usage over time
- Content Views, Content Creates, Content Edits
- Attachments viewed, updated & created
- All timelines are colour-blind friendly with accessible colours being used
Content Report
- Content Views, Content Edits, People & Sessions
- Each page or blogpost listed in the Top Content report is a link to the Content Analytics report for that page or blogpost
Attachments Report
Displays a list of top attachments. For each attachment the following data is displayed
- Attachments Viewed, Attachments Updated, Attachments Created
- The number of people who have interacted with the attachment
- A link view to the attachment
- A link to the Content Analytics screen for the parent page for the attachment
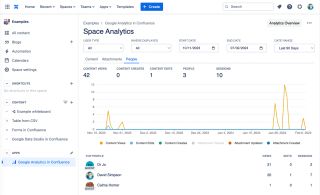
People Report
Showing views and also their editing contributions…
- Content Views, Content Edits & Sessions
- Each person listed is a link to the People Analytics report for that person
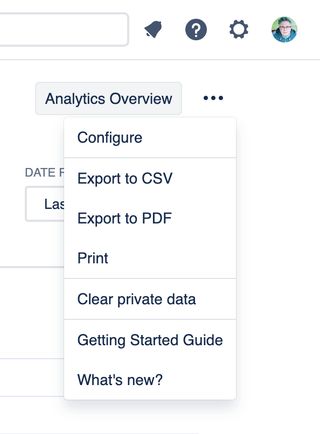
Tools Menu
- Access to the Analytics Overview screen
- Gives export options – CSV, Excel, PDF or Print
- Clear private data – Removes reports data cached in the browsers' localStorage
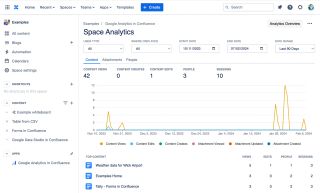
Filter Controls Row
- Filter data
- By user type – All users, internal users, guest users
- By where – The parent product where the content is displayed – All, Confluence, Jira, JSM, Jira Work Management, monday.com, Refined for Confluence, etc
- Separate simple controls for date selection
- Date pickers for start and end dates
- Date Range picker with sensible default date ranges
- Retains the familiar position in the top right of the screen just like in Google Analytics
